Shipping, the most climate-friendly way of transporting goods, represents approximately 3% of global greenhouse gas emissions. To know how to reduce our emissions, we need to know where they come from and how big they are.
This page presents the greenhouse gas (GHG emissions from Grieg Maritime Group (GMG) in 2025. It describes the boundaries considered for accounting and reporting, the calculation methodologies used, the data sources, and the assumptions and exclusions made. The following supporting documentation, in addition to the European Sustainability Reporting Standards, has been used for reporting the Group’s emissions:
• The Greenhouse Gas (GHG) Protocol: A Corporate Accounting and Reporting Standard
• Scope 2 Guidance: An amendment to the GHG Protocol
• Corporate Value Chain (Scope 3) Accounting and Reporting Standards. Supplement to the GHG Protocol. A Corporate Accounting and Reporting Standard
Grieg Maritime Group follows a financial control approach: GMG has financial control over an operation if that operation is considered a group company or subsidiary for financial consolidation, aligning our financial accounting with our GHG accounting.
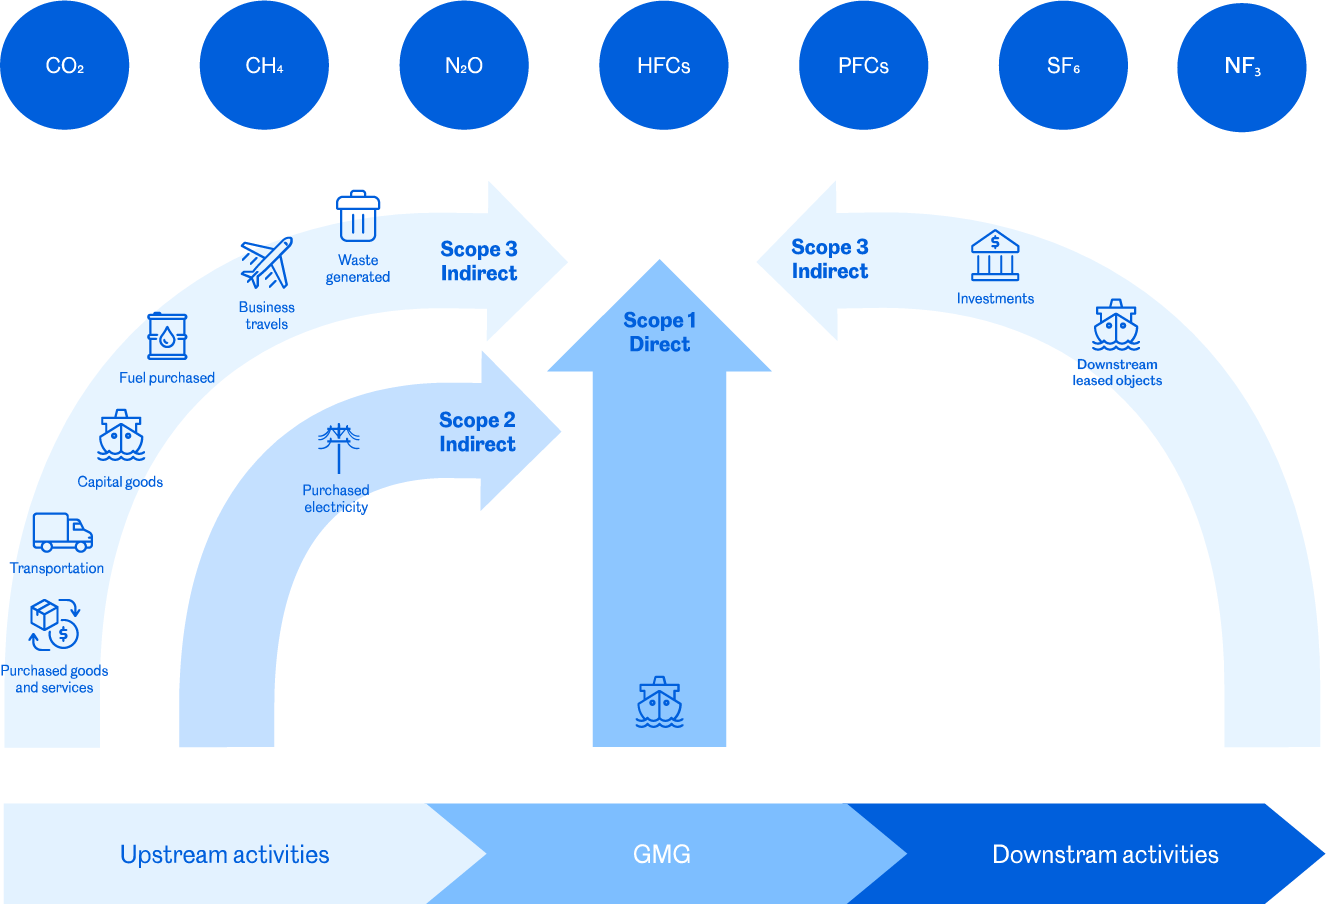
We account for and report the emissions below when applicable, and we report on tons of CO2 equivalent:
• Carbon dioxide (CO2);
• Methane (CH4);
• Nitrous oxide (N2O);
• Hydrofluorocarbons (HFCs);
• Perfluorocarbons (PFCs);
• Sulphur hexafluoride (SF6); and
• Nitrogen Trifluoride (NF3)
Other emissions not included above, such as sulphur oxides (SOx) emissions, are reported under the Pollution chapter of the annual report.
Above is an overview of Grieg Maritime Group scopes and emissions across our value chain.
Direct emissions come from sources that the company owns or controls.
Scope 2 includes the emissions from the generation of purchased electricity, steam, heat or cooling consumed by GMG. It includes the emissions from the acquired electricity for Norway offices and Manila Office, as well as the Company property in Norway and the electricity purchased during drydocking.
Scope 3 emissions are a consequence of the activities of Grieg Maritime Group, that occur from sources not directly controlled by the company. GMG follows the 15 categories from The Scope 3 Standard for accounting and reporting emissions.